Always-On Intelligence


From Question to Finished Output
Ask Across All Your Data
Kaiya Investigates
Get Finished Outputs
Proactive When You Need Answers Waiting.
Conversational When You Want to Explore.
An Agent for Every Mission You Define
NRx Drop Investigator
Revenue Anomaly Monitor
Churn Risk Detector
Executive Brief Generator
Territory Performance Analyst
Patient Adherence Tracker
Pipeline Velocity Agent
Compliance Watchdog
Empower Your People.
Accelerate Work.
Crush Quota.
Every Quarter.


From NRx Drops to Field Actions — in Seconds.

Know Which Promos Worked — Automatically.

Explain the Variance — Before the Meeting.

Crush Backlogs. Drive 100x Adoption.

Billions of Data Points Analyzed.
The Impact Is Real.


Breakthrough Ideas, Right at Your Fingertips
Dig into our latest guides, webinars, whitepapers, and best practices that help you leverage data for tangible, scalable results.
.png)
ThoughtSpot alternative: migrating from ThoughtSpot to Tellius (2026 guide)
Many organizations that adopted search-driven analytics are now looking for platforms that go beyond answering questions to proactively investigating business performance and delivering finished analytical work. This migration guide explains how to move from ThoughtSpot to Tellius while preserving trusted metrics, semantic definitions, dashboards, and user adoption. It compares the two platforms across conversational analytics, automated insight discovery, root cause analysis, AI agents, governance, semantic context, and enterprise scalability.
.webp)
Agentic AI in Supply Chain: Use Cases, Platforms, and What's Shipping (2026)
Supply chain leaders are moving beyond predictive dashboards and generative AI toward agentic systems that can monitor operations, investigate disruptions, recommend actions, and orchestrate workflows across the enterprise. This guide explores the state of agentic AI in supply chain management in 2026, comparing the leading platforms and highlighting the use cases that are delivering measurable business value today. Learn how organizations are deploying AI agents for demand sensing, inventory optimization, supplier risk monitoring, procurement intelligence, logistics planning, production scheduling, transportation optimization, and exception management.
.webp)
Best FP&A Software in 2026: The Tools That Plan, and the Layer That Explains Why
Modern FP&A teams need more than planning software—they need the ability to explain financial performance, identify the drivers behind change, and act faster on emerging risks and opportunities. This buyer's guide compares the leading FP&A platforms in 2026 across budgeting, forecasting, scenario modeling, financial consolidation, reporting, AI-assisted planning, and enterprise analytics. It also introduces a new evaluation framework: distinguishing the systems that plan from the intelligence layer that explains why.
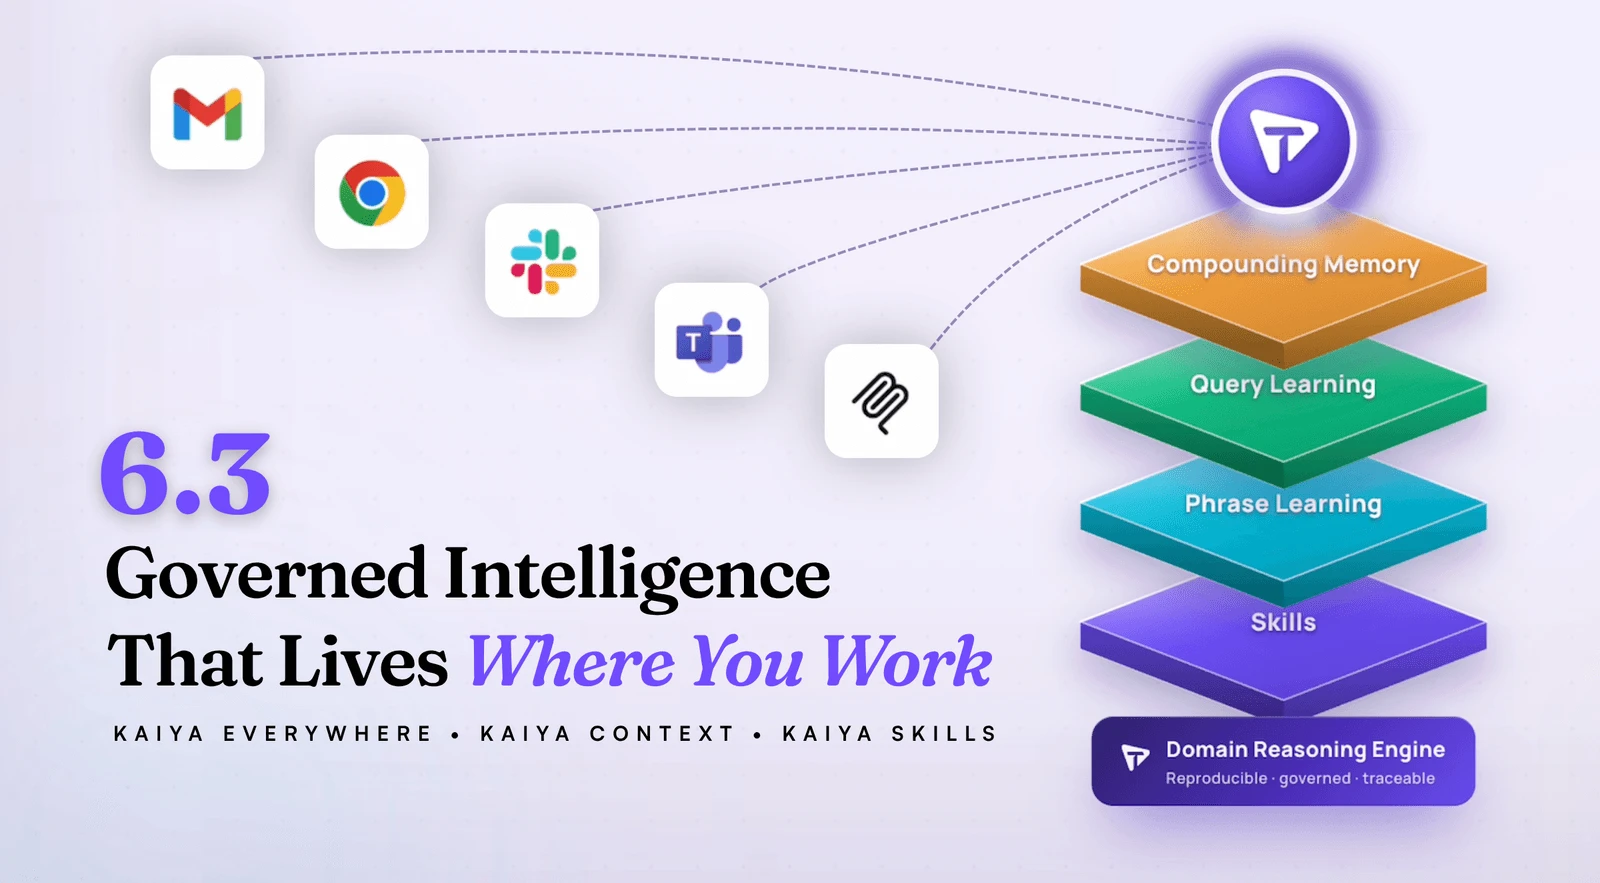
Tellius 6.3: Kaiya Everywhere, Grounded in Your Business
AI answers are only useful when they're grounded in your business and available where decisions actually happen. See how Tellius 6.3 delivers fast, traceable insights across pharma, CPG, RevOps, and FP&A — right in the tools your team already uses.

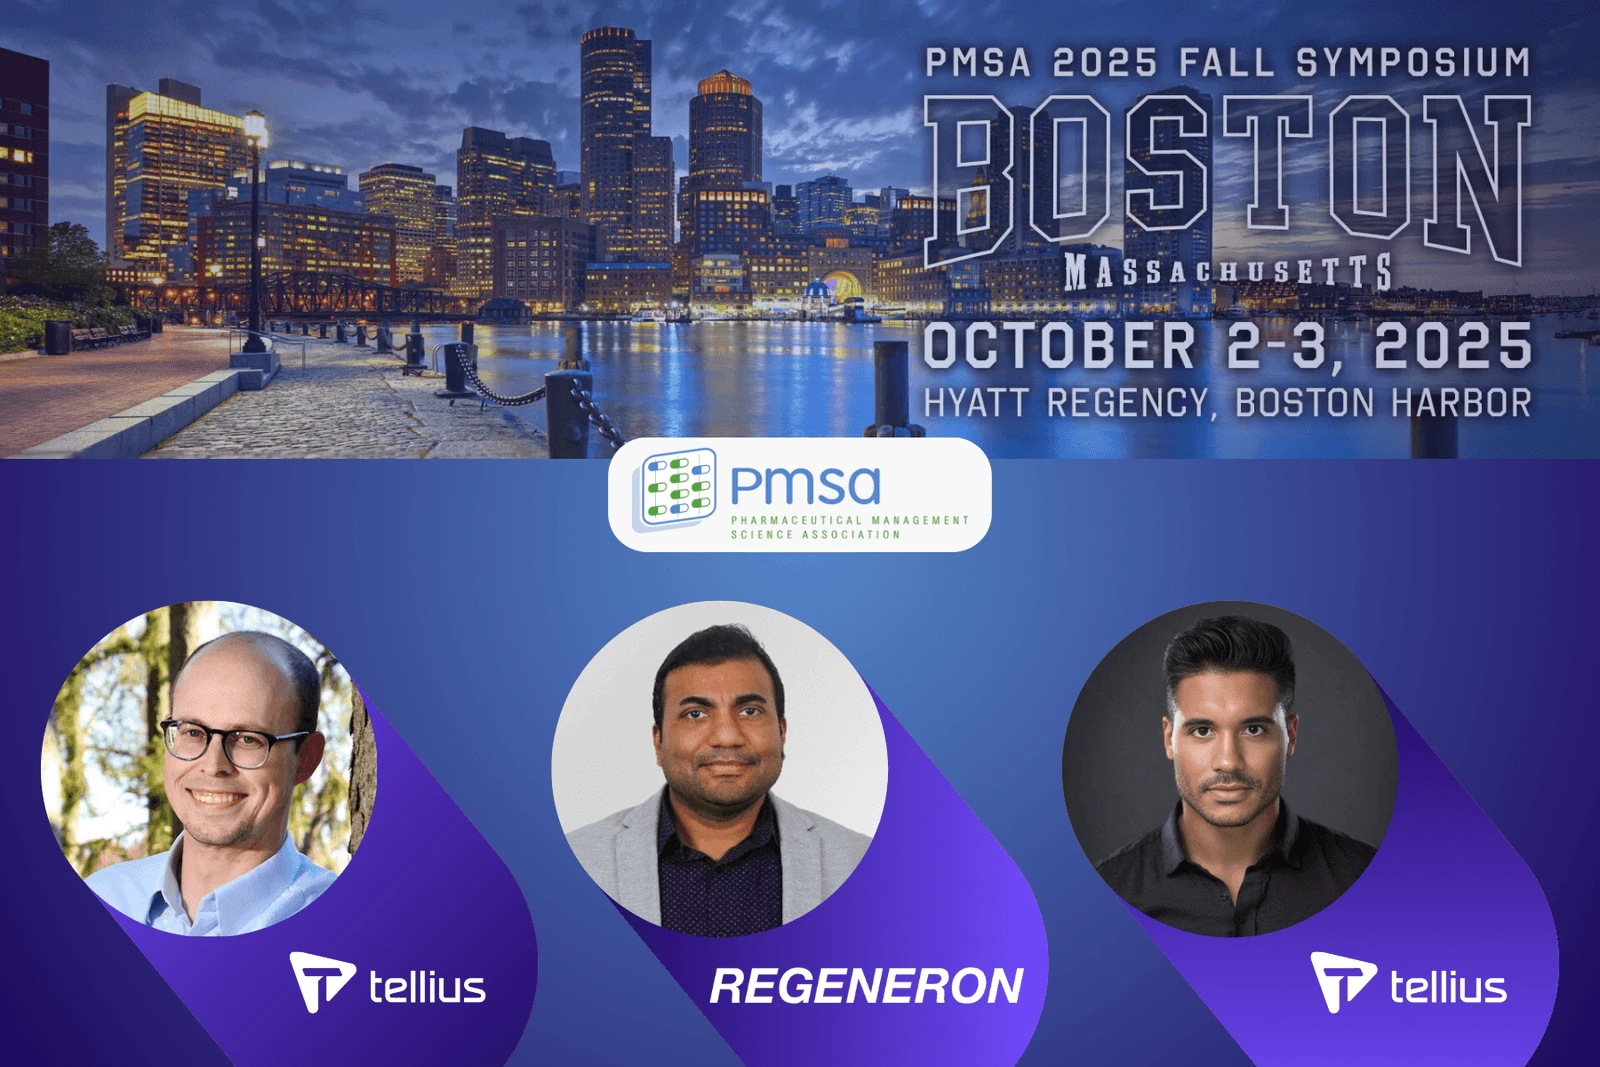
PMSA Fall Symposium 2025 in Boston
Join Tellius at PMSA Oct 2–3 for two can’t-miss sessions: Regeneron on how they’re scaling GenAI across the pharma brand lifecycle, and a hands-on workshop on AI Agents for sales, HCP targeting, and access wins. Discover how AI-powered analytics drives commercial success.
.webp)
Tellius AI Agents: Driving Real Analysis, Action, + Enterprise Intelligence
Tellius AI Agents transform business intelligence with dedicated AI squads that automate complex analysis workflows without coding. Join our April 17th webinar to discover how these agents can 100x enterprise productivity by turning questions into actionable insights, adapting to your unique business processes, and driving decisions with trustworthy, explainable intelligence.