Market Access Analytics for Pharma: Detect Payer Changes Before TRx Falls


In short
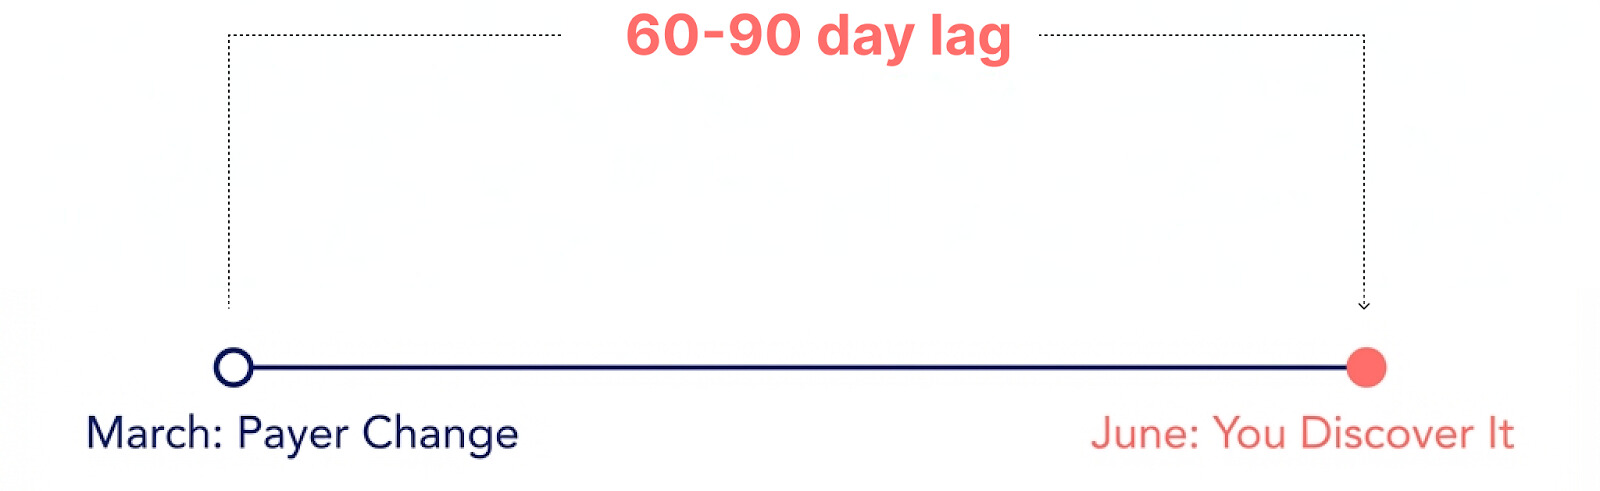
AI-Powered Market access analytics is an AI-based approach that unifies formulary intelligence, claims data, hub services, and specialty pharmacy signals to detect payer changes — formulary exclusions, PA requirement additions, tier shifts — within days rather than the 60-90 day lag of traditional claims reporting. AI agents continuously monitor payer behavior, automatically investigate access barriers, and deliver finished analysis so pharma teams can act before TRx is impacted.
What Is AI-Powered Market Access Analytics?
Your team just got the Q2 claims dump. Market share dropped 7% versus Q1. You need to explain it to leadership by Friday.
So you start the archaeology project. Export Symphony data to Excel. Pull formulary status from three different sources. Check for territory realignment. Review denial codes from hub services. Cross-reference specialty pharmacy signals. By Wednesday afternoon, you've narrowed it down to "probably a formulary change at a major payer in March, but we're not sure which one or exactly when."
The damage was done 90 days ago. You're explaining it now.
Where Market Access Falls Apart Today
Talk to enough market access teams and you hear the same complaints. The data exists, but the infrastructure to make it actionable doesn't.
The 90-Day Blind Spot in Traditional Reporting
The data that shows real payer behavior—adjudicated claims, PA approval patterns, rejection reasons, time-to-therapy—lags weeks or months behind the events that caused it. Payers change step therapy requirements mid-quarter. Prior authorization criteria tighten without announcement. Copay tiers shift. None of it shows up in your monthly reports until the scripts are already lost.
The industry has normalized this lag. "Claims data is always a few weeks behind" is something people say out loud as if it's acceptable. For a 500-rep sales force, that variance between when access tightens and when you detect it can cost you eight figures in lost scripts.
Why Claims Data Lags Behind Payer Decisions
When a plan adds step therapy requirements or tightens PA criteria, that change happens immediately—but adjudicated claims showing the impact don't close until 30-60 days later. Then reporting cycles add another 30 days. By the time quarterly brand reviews surface the problem, you're analyzing damage that's been happening for months.
How AI Transforms Market Access Workflows
The gap between high-performing and low-performing market access organizations isn't headcount or budget. It's whether they can see and respond to payer changes before those changes show up in quarterly brand performance.
High-performing teams treat market access data as a real-time operational input, not a monthly reporting output. They've moved from "here's what happened last quarter" to "here's what's changing this week and what we're doing about it."
Semantic Layer: Teaching AI Your Business Logic
Generic BI tools don't speak pharma market access. They don't know that "prior authorization" can mean anything from a 5-minute phone call to a 15-page clinical dossier depending on the payer. They don't understand that step therapy sequences vary by line of business. They can't tell you whether a tier 2 position is actually preferred when the copay is $75 versus $15.
Market access analytics encodes your business logic: how to calculate true time-to-therapy (prescription written → benefits verification → PA submission → approval → first fill), what constitutes a "hard" versus "soft" step edit, how to attribute changes to policy shifts versus normal volatility, when formulary status and utilization management rules conflict.
Tellius has spent 7+ years building this semantic layer. It's what makes AI agents understand pharma market access. ChatGPT and Claude can't do this—they don't have the pharma-specific semantic understanding or the infrastructure to work for hours on complex investigations.
Data Federation: Unifying Payer, Claims, and Hub Sources
Market access questions require pulling from formulary intelligence, claims feeds, hub case management, specialty pharmacy signals, and field intel. Most teams export all of this to a data warehouse and write custom queries for every question. That works for monthly reports. It doesn't work when you need to investigate "why did abandonment spike at this payer last week?" quickly.
The platform connects to these sources directly and handles the reconciliation continuously: different payer identifiers across vendors, update cycle mismatches (hub data daily, claims weekly, formulary monthly), line of business and channel differences.
You query across systems in natural language. The platform handles the joins, validates the results, and tells you when data coverage is incomplete.
AI Agents: From Manual Investigation to Automated Analysis
Traditional BI shows you that PA approval rates dropped 18%. Then you spend two days figuring out why. AI-powered analytics investigates automatically—agents working in parallel checking for policy changes, analyzing denial patterns, calculating time-to-therapy changes, scanning for competitive events, determining payer hierarchy patterns.
Minutes later: "Your approval rate dropped from 67% to 49% at UnitedHealthcare commercial plans in the Northeast. 62% of the variance came from new step therapy requirements added March 15th requiring documentation of two prior treatment failures. 28% came from a PA template update requiring specific lab values. Affected accounts represent 340 annual TRx at risk."
That's not a dashboard showing red. That's an investigation with finished artifacts—PowerPoint deck with analysis, Excel model with TRx impact projections, and recommended actions—delivered automatically.

Key Capabilities of AI-Powered Market Access Analytics
Formulary Change Detection
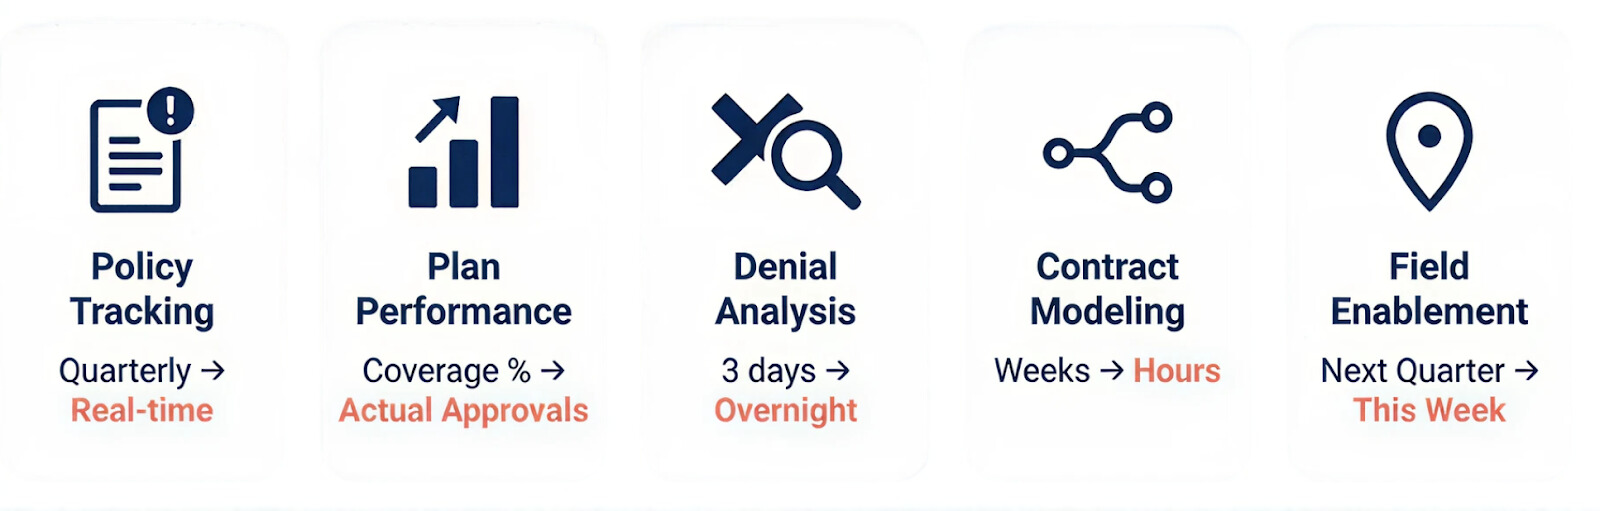
AI agents continuously monitor payer documents, policy updates, and specialty pharmacy signals. When plans update utilization management requirements or change tier positions, the system flags those changes within days—not after the quarterly claims dump arrives showing TRx already dropped. One top-20 pharma company reduced detection lag from 90 days to 5 days using continuous monitoring on their top commercial payers.
Payer Performance Analysis
Coverage status doesn't equal pull-through. Two plans can look identical on paper—both preferred tier 2, both covering your indication. But one processes PA approvals in three days with minimal documentation requirements. The other takes three weeks and rejects 40% of initial submissions for missing clinical criteria. Covered lives is a vanity metric. What matters is whether patients who get written a prescription actually start therapy. AI-powered analytics shows you the difference—one plan converting at 65% and the other at 23%—in time to adjust your strategy.
Prior Authorization Monitoring
Industry data shows 37% of PA-related abandonment is recoverable if you can identify the specific barriers causing drop-off. Most teams can't pinpoint whether failures came from missing documentation, clinical criteria mismatches, payer-specific admin rules, or something else. The platform links PA denials to specific criteria failures across payer hierarchies, showing which documentation gaps and clinical requirements drive abandonment—so your team knows exactly where to intervene.
Contract and GTN Scenario Modeling
Gross-to-net forecasting and IRA scenario planning still run on fragile spreadsheets where one misplaced formula can throw off your entire portfolio projection. When Aetna proposes better formulary position in exchange for higher rebates, you're modeling the tradeoff in Excel tabs that five people maintain and nobody fully understands. AI-powered scenario modeling runs three variations (conservative, expected, optimistic) using historical data from similar formulary moves at other payers. Leadership sees the full picture with confidence intervals. Finance can audit the methodology.
Augmented Field Enablement
Your team negotiates a tier improvement at a major payer. Traditional communication: email to regional directors, mention on next brand call, eventually a field deck. Six weeks pass before reps know. The pull-through window shrinks with every day of delay.
The platform detects formulary improvements automatically and pushes intelligence directly to CRM within 48 hours—identifying which territories have meaningful exposure, flagging HCPs with high patient panels at that payer, and delivering specific messaging. Reps log in Monday to prioritized accounts, not a buried email from three weeks ago.
AI-Powered Market Access in Action: Four Scenarios
Detecting Access Deterioration Before TRx Drops
You're three weeks into Q2. Performance dashboards look fine. But continuous monitoring detects that Anthem's PA approval rate for your brand dropped from 72% to 53% over the past two weeks in commercial plans.
Traditional analytics won't show this for another 30-45 days when claims data closes. By then, you've lost 6-8 weeks of intervention time.
The platform automatically investigates overnight and delivers a formatted report Monday morning: 3-slide PowerPoint deck identifying that Anthem added new step therapy requirements April 3rd requiring documentation of prior biologic failure, quantifying that 45% of PA submissions now fail this criterion, and recommending specific hub template updates and top 20 prescriber coordination.
Instead of discovering this in June through claims reports, you're acting in April while most of Q2 is still recoverable.
Diagnosing Regional Performance Gaps Overnight
Brand leadership asks why TRx/NBRx is underperforming in the Southeast despite strong rep activity and good formulary position. Meeting Friday morning. It's Tuesday evening.
Traditional approach: three days of analyst work pulling claims by region, exporting CRM activity, checking formulary status, manually correlating performance to access barriers, interviewing regional managers, building PowerPoint deck.
AI-powered analytics runs overnight Tuesday. By Wednesday 8am, you have a finished 5-slide PowerPoint deck: TRx/NBRx variance decomposed by payer, showing 68% of the Southeast shortfall concentrates in Cigna and Humana plans, surfacing that both payers enforce stricter PA criteria in FL/GA/AL than other regions (4-week longer average approval times), quantifying that this timing difference correlates with a 31% lower NBRx conversion rate, and recommending payer escalation strategy plus hub staffing adjustments.
Brand team has defendable explanation in 8 hours instead of 3 days.
Modeling Contract Scenarios Without Excel
CVS Caremark proposes moving you from non-preferred to preferred tier 2 in exchange for a 15% rebate increase. You need to model the net revenue impact by Friday.
Traditional approach: two weeks of exporting volumes, estimating elasticity, modeling rebates, guessing at UM changes, reconciling conflicting Excel versions.
AI agents run scenarios with three variations by Thursday morning. You get finished Excel models for each scenario showing volume lift, PA approval rate changes, time-to-therapy impact, abandonment at different copay tiers, net revenue after rebates, and clear assumption documentation. Side-by-side comparison in PowerPoint.
The decision is made with evidence rather than gut feel and fragile formulas.
Activating Field Teams Within 48 Hours
Your team negotiated improved access at Aetna commercial plans effective June 1st—tier 3 to tier 2 with relaxed PA requirements. This represents opportunity across 180 territories. The formulary change is official but field teams don't know yet.
Traditional approach: access team sends email to regional directors, directors mention it on next brand call (maybe), it makes a field communication deck (eventually), reps find out weeks later. Six weeks of the advantage is gone.
The platform detects the Aetna tier improvement June 1st automatically. Within 48 hours, the system analyzes which territories have meaningful Aetna exposure, identifies HCPs with high Aetna patient panels, flags accounts previously affected by old tier 3 restrictions, and pushes this intelligence directly into CRM as priority targets with specific messaging.
Reps log in Monday morning to see: "Dr. Martinez has 23 Aetna patients who were previously facing $65 copays and PA delays—now $15 copay with streamlined approval. Prioritize this week."
How to Implement AI for Market Access
Full enterprise deployment takes 9-13 months. But you don't need to wait that long to prove the concept. Three quick wins that work well as pilots:
Early warning for your top 3 commercial payers. Deploy continuous monitoring for PA approval rates and formulary changes at your highest-volume commercial payers. Generate automated alerts when approval rates drop or policies change. Measure time savings: days to detection versus quarterly lag.
Automated performance diagnosis for one brand. Connect market access analytics to claims, formulary, and hub data for a single brand experiencing performance questions. When leadership asks "why is Southeast underperforming," generate the full analysis overnight instead of 2-3 day manual investigation. Track analyst time savings and decision speed.
Pre-close access validation for Q3. Run continuous data quality checks during Q3 performance period. Flag payer ID mismatches, hub coverage gaps, formulary status conflicts before they become post-close restatements. Compare issues caught in-period versus historical post-close discovery rates.
Reminder: This is a 6-figure investment with 8-figure impact potential. Companies that try to compress the timeline either cut corners on semantic layer design or skip change management. Both create problems that take longer to fix than the time "saved."
AI Analytics vs Traditional BI for Market Access
Why Tableau and Power BI Fall Short
Generic BI tools can visualize market access data. What they can't do is explain it.
When a market access leader asks why PA approvals dropped at a specific payer, Tableau shows a chart. It doesn't investigate across five data sources, identify that a formulary change removed a key coverage pathway, quantify the TRx impact, and generate a PowerPoint deck a brand director can actually share with leadership.
Three key differences:
- BI tools don't have pharma domain knowledge baked in—they don't understand TRx versus NBRx, how payer mix affects territory potential, when formulary changes require quota relief, what drives PA approval rates.
- They're not built for natural language interaction grounded in governed business logic. You can add a chatbot on top of Tableau, but it's still just querying tables—it doesn't know your semantic model or business rules.
- They can't deploy workflows that investigate in parallel and synthesize findings into finished artifacts. They visualize data. They don't do the analyst's work.
This matters when you're choosing between market access analytics and Veeva Compass, IQVIA analytics, or Komodo as well. Purpose-built platforms that encode market access logic and deliver finished analysis automatically operate in a different architectural layer than tools that visualize data and expect humans to interpret it.
Why ChatGPT and Claude Can't Replace Purpose-Built Platforms
ChatGPT and Claude are general-purpose LLMs. They don't understand your payer hierarchies, PA business logic, or formulary tier structures. They can't connect to your claims, hub, and specialty pharmacy data. They can't work for hours investigating complex market access problems. And they can't deliver finished PowerPoint decks and Excel models—they just give you text answers.
Tellius has spent 7+ years building the semantic layer, insights engine, agent orchestration, and artifact generation that makes AI agents actually work on messy pharma market access data. That proprietary infrastructure lets agents automate workflows end-to-end instead of just answering questions.
Implementation Reality (The Boring Stuff That Determines Success)
Agentic analytics works. Implementation is where most teams either succeed or struggle. A few things matter more than others.
Start with semantic layer, not flashy demos
The temptation is to jump straight to conversational interfaces and automated agents because they're impressive. That's backwards. If your payer identifiers don't match across formulary intelligence, claims, and hub systems, agents will generate plausible-sounding but wrong explanations.
Successful implementations start by building the semantic layer:
- Standardize payer and plan identifiers across sources (this is harder than it sounds)
- Map line of business consistently (commercial ≠ Medicare Part D ≠ Medicare Advantage ≠ Medicaid Managed Care)
- Establish governed metric definitions (how does your organization calculate time-to-therapy, approval rate, abandonment?)
- Document data lineage and update cycles
- Encode market access business logic into the system
Budget 4-8 weeks for this depending on how fragmented your current data is. Rush it and you'll spend months debugging incorrect agent outputs. This is the foundation everything else depends on.
Crawl → Walk → Run
Trying to deploy agents across all therapeutic areas, payers, and use cases simultaneously is how projects die. What actually works:
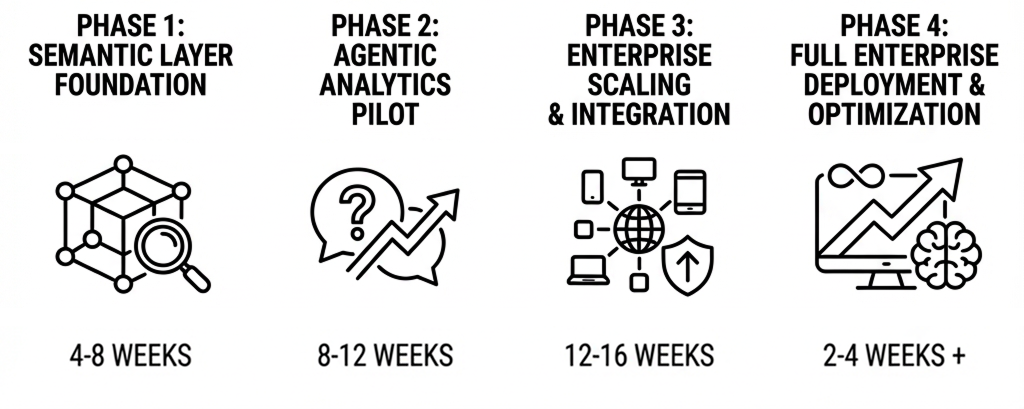
Phase 1 (6-8 weeks): One brand, one high-value workflow (PA approval monitoring or formulary change tracking), core agent capabilities only. Goal is validating semantic layer accuracy and proving agents deliver value without manual intervention.
Phase 2 (8-12 weeks): Expand to 2-3 additional brands, add scenario modeling agents and denial root cause agents. Start scheduling agents to deliver artifacts automatically (weekly payer performance decks, triggered formulary change alerts). Integrate agent outputs into CRM for field activation.
Phase 3 (12-16 weeks): Broader deployment across portfolio, advanced orchestration (multi-step workflows chaining investigation → recommendation → artifact delivery), predictive agents for payer behavior modeling.
Total timeline: 26-36 weeks from kickoff to enterprise deployment. Companies that try to compress this either cut corners on semantic layer design or skip change management. Both create problems that take longer to fix than the time "saved."
Governance is not optional
Agentic systems work fast and deliver finished artifacts automatically. That's powerful, but it also means you need clear guardrails:
- Who owns metric definitions and business logic in the semantic layer?
- When can agents act autonomously (schedule delivery, trigger workflows) versus only recommend?
- How do you audit what agents produced and validate accuracy?
Operating principle: agents propose, humans validate and decide. Agents surface findings and deliver finished analysis. Your team validates key decisions and executes strategy. Especially when multi-million dollar contract decisions are involved.
Plan for the role shift
Your market access analysts have been doing data wrangling, manual investigation, and PowerPoint deck building for years. Agents automate that work. Be explicit about what their job becomes:
- Validating agent outputs and flagging edge cases
- Governing semantic layer definitions and business rules
- Interpreting findings for payer strategy and brand teams
- Doing the deeper strategic analysis that never had time before (predictive payer modeling, portfolio scenario planning, competitive intelligence synthesis)
If you don't address this transition head-on, you'll get resistance instead of adoption. The goal isn't to replace analysts—it's to automate the grunt work so they can focus on strategy that actually influences payer outcomes.
Where Tellius Fits
Tellius is an agentic analytics platform purpose-built for pharmaceutical market access teams. What makes it work:
1. Pharma-native semantic understanding: The system knows what PA approval rates, step therapy sequences, time-to-therapy, and formulary hierarchies mean. You don't have to teach agents your business—Tellius already understands the difference between a payer policy change and normal noise, when tier position matters versus when utilization management trumps everything, and how to attribute performance shifts to access barriers versus field execution.
2. AI agents that automate workflows end-to-end: When you ask why PA approvals dropped at a specific payer, Tellius doesn't return a chart. Agents investigate: checking for policy changes, analyzing denial patterns, comparing to peer payers, linking to TRx/NBRx impact—then deliver a finished PowerPoint deck with analysis, Excel model with projections, and recommended actions. The investigation that would take an analyst 2-3 days happens automatically overnight. This is AI-performed analytics, not AI-assisted.
3. Unified data layer for market access: Tellius connects formulary intelligence, claims, hub services, and specialty pharmacy data through pre-built connectors and handles payer ID reconciliation automatically. You're not manually joining five systems for every question. Agents query across sources automatically, validate results, and flag data gaps.
4. Artifact engine for finished deliverables: Agents don't just give you insights—they deliver formatted PowerPoint presentations, Excel models, and PDF reports. Leadership gets finished artifacts they can share immediately, not data dumps that require manual deck-building.
Our semantic layer, insights engine, agent orchestration, and artifact generation represent 7+ years of engineering specifically for enterprise analytics workflows. This is the moat that makes AI agents actually work on complex pharma market access data—the infrastructure ChatGPT and Claude don't have.
Result: Market access teams see payer changes in days instead of quarters, diagnose access barriers automatically overnight instead of 2-3 day manual investigations, and activate field teams within 48 hours of formulary improvements while pull-through opportunities still exist.
Frequently Asked Questions
Understanding Market Access Analytics
What is market access analytics? AI-powered platform that unifies formulary, claims, hub, and SP data to detect payer changes in days vs 90-day claims lag. AI agents monitor continuously, investigate automatically, and deliver finished artifacts.
How does AI help pharma market access teams? Automates investigation, monitors payer changes continuously, delivers finished analysis (decks, models) overnight. Transforms market access from quarterly forensics into real-time operational intelligence.
What's the difference between AI analytics and traditional BI for market access? BI shows what happened. AI analytics explains why and delivers recommendations automatically. When PA approval drops, you get a PowerPoint deck with root cause analysis—not a chart requiring 2-3 days of manual investigation.
Can AI detect formulary changes before they impact TRx? Yes. AI agents monitor payer documents and policy signals, flagging changes within days vs waiting for claims. One top-20 pharma reduced detection from 90 days to 5 days.
Implementation and Data
How long does it take to implement AI for market access? First value in 6-8 weeks (pilot). Full deployment in 6-9 months depending on data complexity. The 4-8 week semantic layer foundation is non-negotiable.
What data sources are required? Formulary intelligence, claims/Rx data, hub services, specialty pharmacy. Platform handles reconciliation across different payer identifiers and update cycles automatically.
Can this work if our data is fragmented across multiple systems? Yes—that's exactly what the data federation layer solves. You don't need a perfect data warehouse. The platform handles payer ID mapping, different update cycles, and line of business nuances automatically.
Differentiation and Comparison
How is this different from using ChatGPT for market access? ChatGPT doesn't understand payer hierarchies, PA logic, or your business rules. It can't connect to your data, work for hours on complex investigations, or deliver finished PowerPoint decks and Excel models.
What is the best AI analytics platform for pharma market access? Best platforms combine semantic layer (pharma business logic), data federation (payer + claims + hub), and AI agents that deliver finished artifacts. Tellius is purpose-built for this—7+ years of pharma-specific infrastructure.
What should I look for in a market access analytics platform? Key criteria: pharma-native semantic understanding, multi-source data federation, automated investigation (not just dashboards), artifact delivery (PowerPoint, Excel), and explainable AI for compliance.
How do I evaluate AI analytics vendors for pharma? Ask: Does it understand PA logic, formulary hierarchies, payer rules natively? Can it connect formulary, claims, hub, SP data? Does it investigate automatically or just visualize? Does it deliver finished decks or just text answers?
What's the difference between AI analytics platforms for pharma? Generic platforms (Tableau + ChatGPT) lack pharma semantics. Horizontal AI tools can't work for hours on complex investigations. Purpose-built platforms encode market access logic and deliver finished analysis automatically.
Which AI platform do pharma market access teams use? Leading pharma companies use platforms with pre-built market access semantics, payer data connectors, and AI agents that automate investigation workflows—reducing detection lag from 90 days to under a week.
ROI and Outcomes
What ROI should market access teams expect? 60-90 days earlier detection, 2-3 day investigations reduced to overnight, 37% of PA abandonment becomes recoverable. For a 500-rep sales force, the cost of missing access problems far exceeds the 6-figure investment.
What outputs does the platform deliver? Finished artifacts automatically—PowerPoint presentations, Excel models, and PDF reports formatted and ready to present. Leadership gets finished presentations, not data dumps requiring manual deck-building.
Getting Started
The companies making progress aren't buying better dashboards. They're deploying AI agents that work 24/7 to detect formulary and UM changes before TRx falls, automatically investigate which payer barriers drive abandonment, connect coverage status to actual patient access, and deliver finished PowerPoint decks and Excel models overnight.
The alternative is the status quo: quarterly surprises, claims lag that makes every access problem a forensics exercise, manual investigations that take 2-3 days per question, and payer strategy teams explaining what happened instead of preventing what's next.
Your portfolio can't afford to wait 60-90 days to find out that access deteriorated at your top three commercial payers.
Want to see AI-powered analytics work on your market access data? We can show you AI agents detecting policy changes, investigating root causes overnight, and delivering finished PowerPoint decks automatically—using your actual data structure and business logic.
Get release updates delivered straight to your inbox.
No spam—we hate it as much as you do!
