In This Post
Introduction
A few weeks ago, I had an interesting conversation with a Business Intelligence (BI) leader at a major global pharmaceutical company. Despite it being a virtual meeting, a tangible mix of emotions emerged including anxiety, urgency, and excitement. He was anxious that, despite having the best analytics and data people in the industry and “all the BI tools under the sun” — an ironic ‘analytics happy-land’ — they were still missing crucial capabilities to produce and serve the business with insights from their data with speed and scalability. There was a sense of urgency to our conversation because he knew the stakes for getting analytics wrong have never been higher. There was excitement in his voice from the hope that there is a better way to scale analytics in a meaningful way.
What was missing in this BI Leader’s analytics happy-land? Before we answer this question, let’s take a look at the state of BI tools and processes today.
The Mechanical Way
Think about the last time you used a piece of technology and felt it was intuitive. Chances are, B2B systems (CRMs, ERPs, BI, etc.) did not come to mind. You might have thought instead of a Google search, a Netflix movie recommendation, or an assist from Siri. The difference between these (typically) seamless experiences and frustrating B2B system’s “dumb” answers because we didn’t frame things in just the right way — is AI. Not generic AI — but AI smarts, subtly designed into technology — providing information in a useful way. This type of AI has great potential to help us work more naturally the way we (humans) are hardwired to think and explore.
Humans are curious, collaborative, and intelligent. Our business systems are the exact opposite — they require us to think and communicate more like a machine to get what we want. To answer the question posited earlier, this gentleman’s BI experience was likely lacking humanity. In analytics and BI particularly, interacting with data should not require code expertise or point-and-click ninja skills (even though both are highly valuable). AI should be applied to augment the user experience, making our work lives more productive and less dependent on skill sets we don’t have.
In this blog post, the first in a series, I will explore how AI can make the BI experience more human and help us unlock more of BI’s true potential — by enabling curiosity.
Curiosity
Humans are naturally curious. Two-year-olds incessantly ask why about everything. From the mundane (checking what our phone’s notification will say) to the epic (exploring space!) to everything in between (watching cheesy Hallmark mystery shows), pursuing our curiosity and seeing what happens next is what we humans do. Ironically, the more we dig into a mystery, the more rewarding it is when we finally get the answer.
Most of today’s BI tools and dashboards stifle curiosity. They offer guardrailed experiences on aggregated data. If you find an interesting insight (sales dropped last month in the Northeast!) and want to get at the root cause, there are several technological and process-related roadblocks in the way today. Drilling down in the tool quickly bumps up against granularity limitations since it is on aggregated datasets. Multiple tools and manual inputs may have been chained together without much documentation to generate the insight in the first place (transparency/ lineage issues). Slicing-and-dicing data with SQL could be beyond the average user’s technical abilities. Middlemen and necessary interim steps abound. Data literacy, bias, and other trends are stifling. Bottom line: chasing your curiosity in BI today is painful, and leads to bottlenecks and a growing and costly insights gap.
Conversations with data should be a back-and-forth dance whose only prerequisites are business knowledge and a healthy dose of curiosity. Users should be able to ask questions of their data in natural language (Search) and get both visual interpretations and verbal explanations of patterns and relationships in the data (Insights). The verbal explanations should be clear, with minimal jargon and maximal business interpretation. If you get ambitious and would like to build a more powerful insight through machine learning yourself (to look around the proverbial corner), you should be able to point to the variable of interest and let the tool do the modeling legwork and present back to you what is significant (AutoML) — not have to understand which specific algorithms and hyperparameters to select to map to your specific business questions.
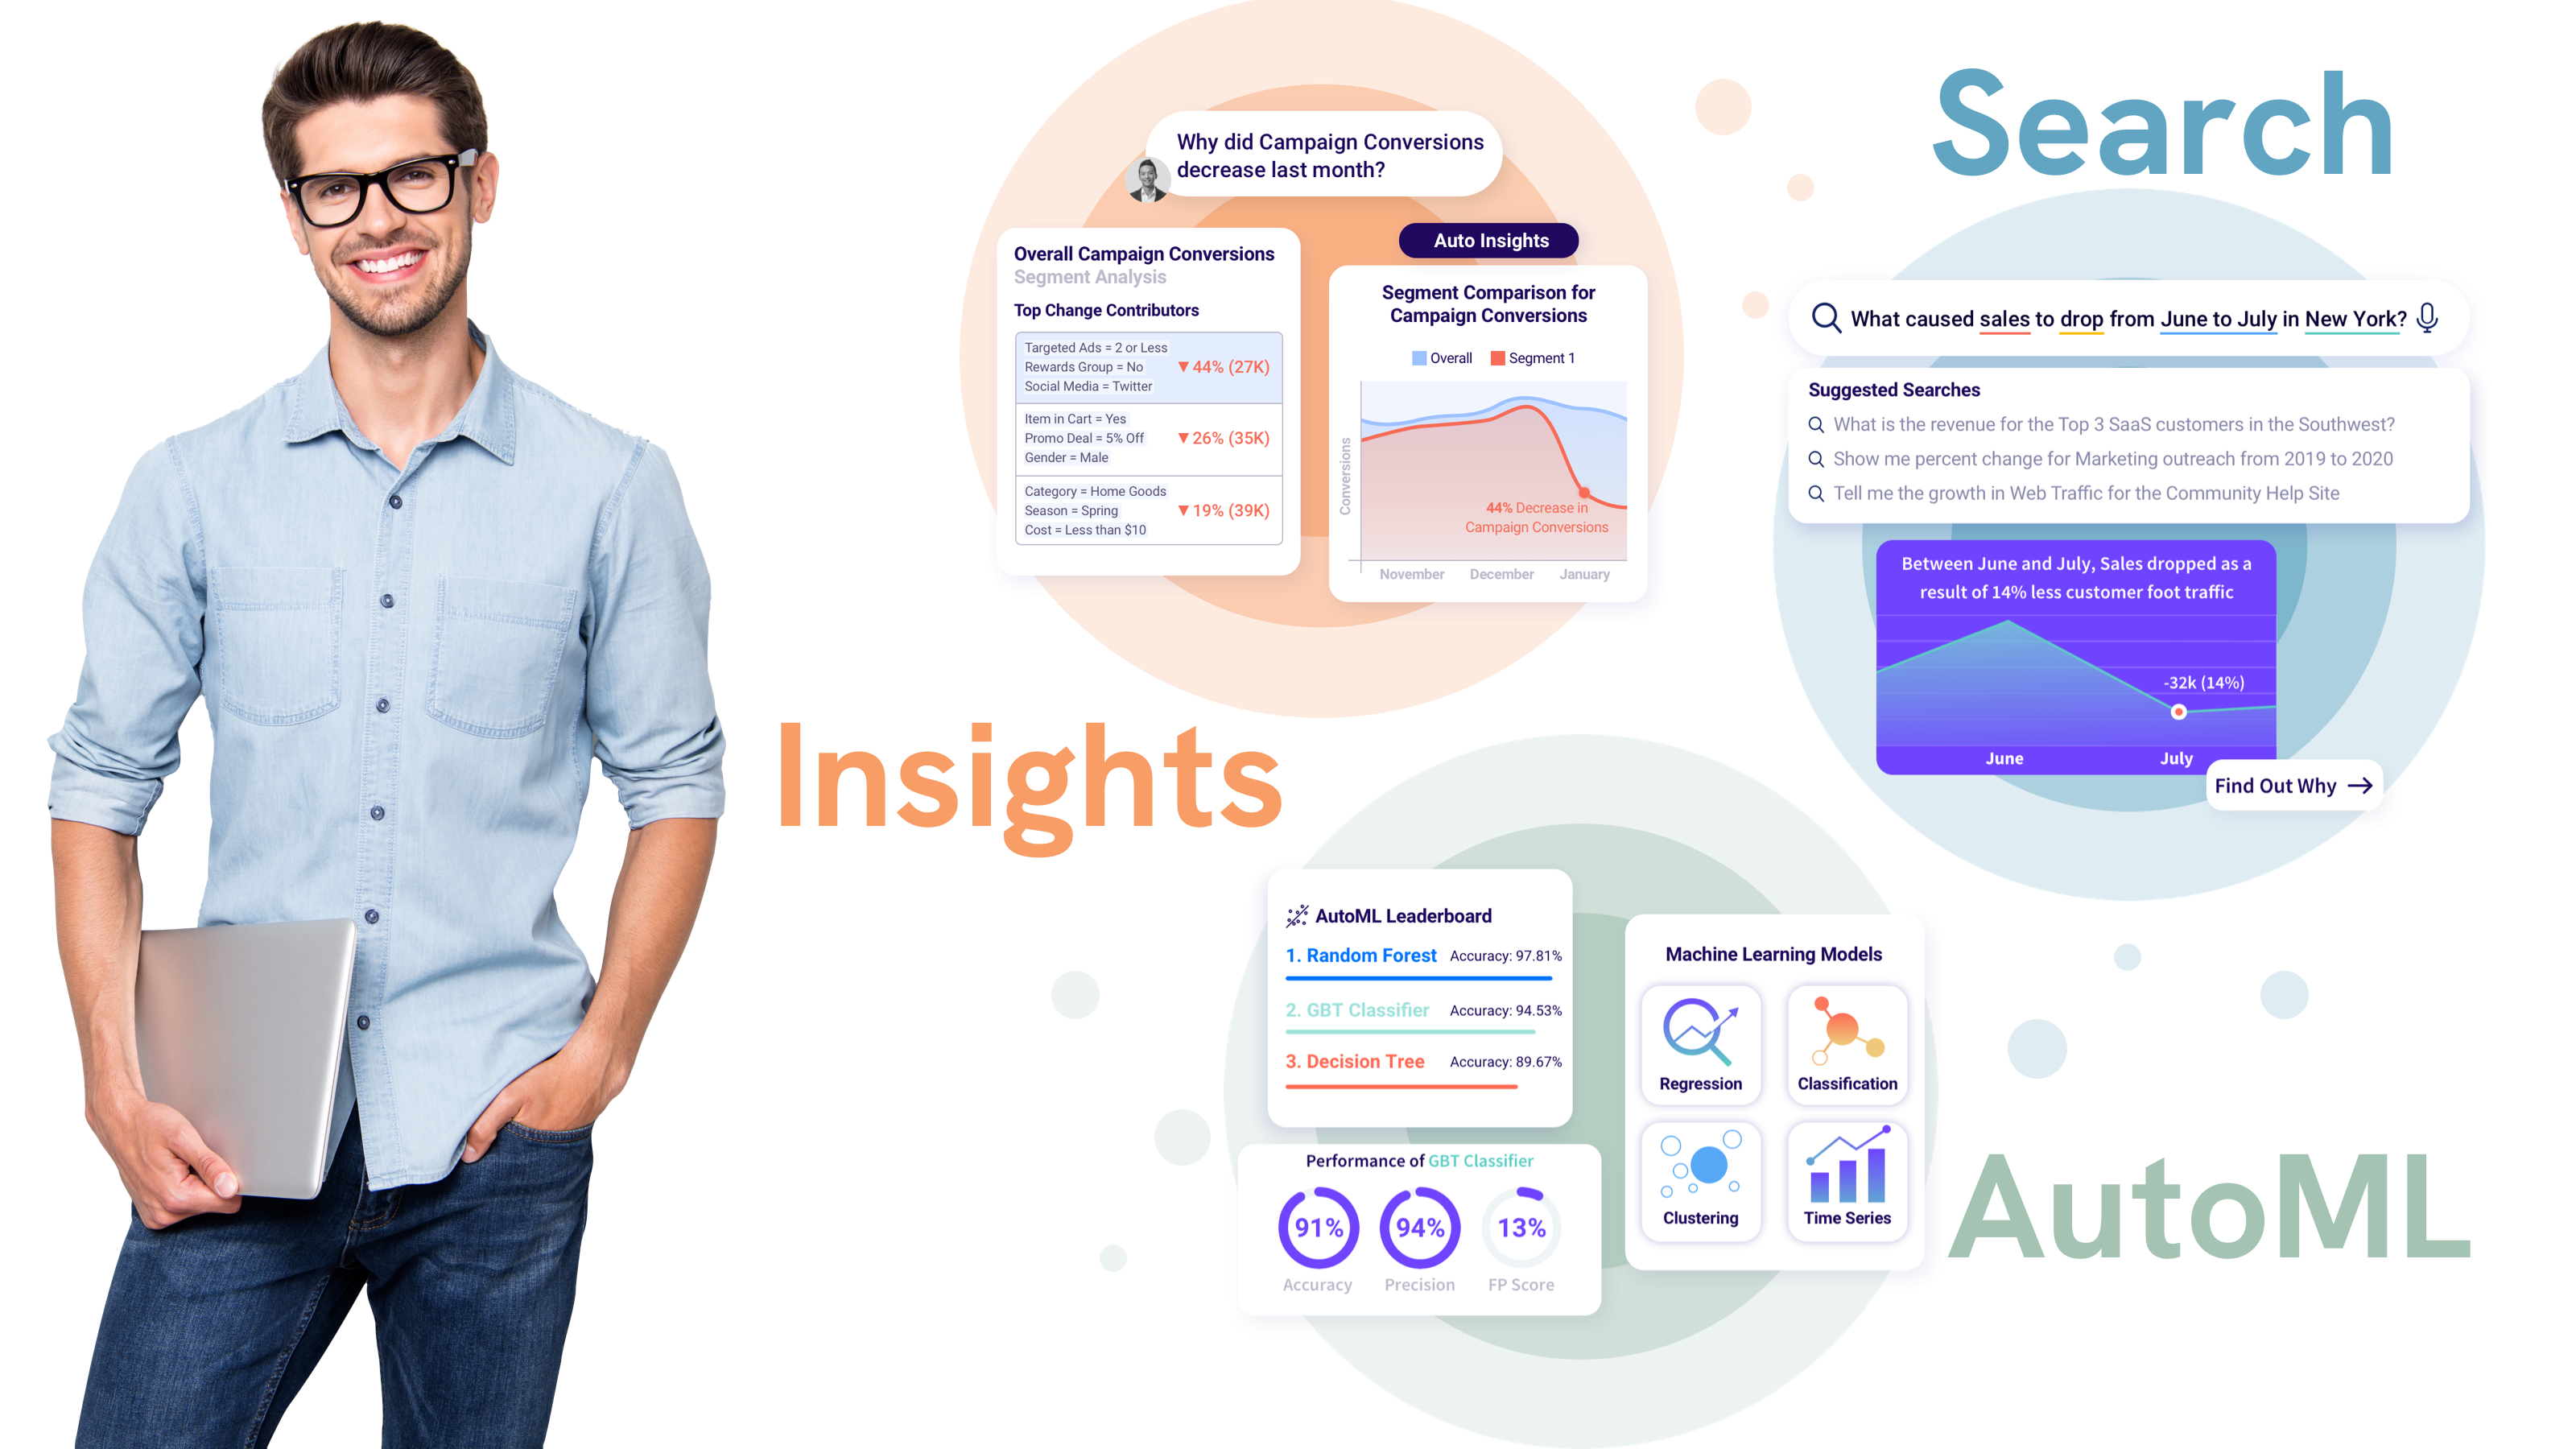
At Tellius, we utilize AI as a means to an end, with the sole purpose of accelerating the journey from data to insights and business outcomes for users. Our platform enables a more approachable exploration of the business questions users have, which naturally flows into insights and explanation generation when the user asks for them and provides insights and notifications when anomalies arise too. We accomplish this via the Tellius Trifecta.
The Search/Insight/AutoML Trifecta
Analysis — and curiosity, for that matter — starts with a question. We are all familiar with business questions sprouting from static operational dashboards, sleek slice-and-dice visualization tools, or from SQL queries that we modify and re-submit countless times. Most of us have been there and have “fond” memories about these processes.
What might a more natural approach to all this look like? Maybe a question like this (Search): What drives my conversion rate? An analytics tool could take that question, interpret it, analyze it, and produce a powerful combination of visuals and narratives that explain the contributors in business vernacular (Insights)? Once I understand the drivers of my business question, I may want to produce a more sophisticated model based on my data that i can share with my data scientists or operations counterparts (AutoML). Can I do that with a minimal number of clicks, while the tool has my back and does all the heavy lifting (data treatments, multiple models tournament, selection of the best models and then formulation of an explanation for the driving factors)?
At Tellius we use this Search/Insights/AutoML Trifecta to augment the user experience so users can focus on solving their business problems rather spending time shaping their queries in a specific format or learning to code. The more seamless and intuitive the experience, the more powerful the intelligence under the hood must be. Let’s explore the details behind this intelligent trifecta.
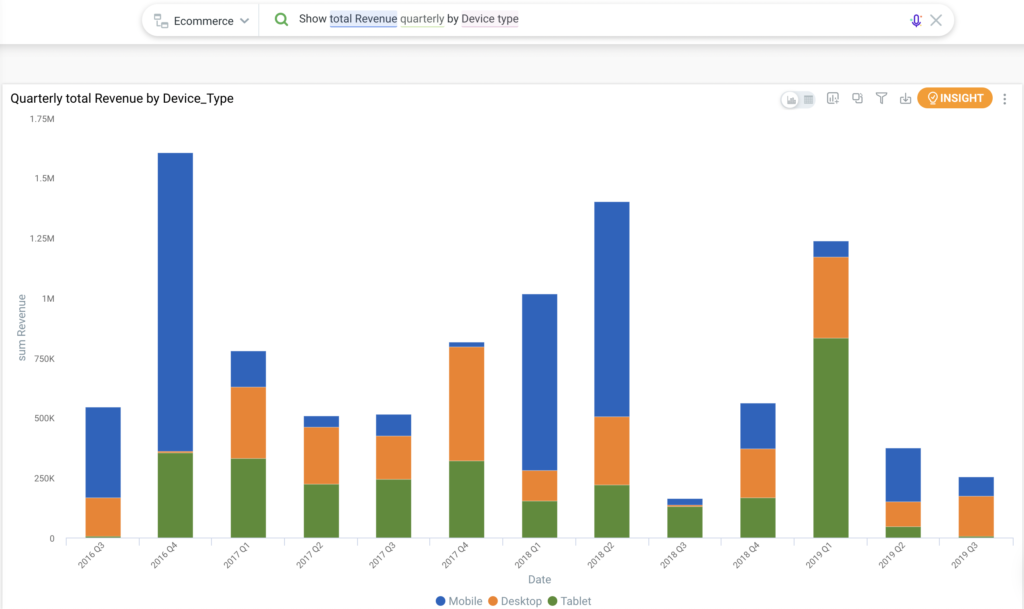
Search: Strike Up a Conversation
AI methods in the search and conversational space have become so robust that literally asking one or more questions of your data should be table stakes. Your tabular data is already organized for operations like querying and slicing-anddicing. Why not use natural language processing to understand full length questions, map entities to data descriptions and values, and serve back smart visualizations that answer a question based on its initial intent?
Tellius Search was built organically to answer business questions on top of business data. The Search workflow goes through the traditional query stages of interpretation, suggestions, and execution. This workflow is where the innovation and power of the Tellius natural language understanding (NLU) methods kick-in.
Tellius uses robust Neural Network models optimized for query interpretation. Under the hood Tellius uses LSTM models and search engine indexing for entity extraction, search ranking for current and next word suggestions, misspelling correction, and query intent prediction. Once the query is received, further refinement occurs with auto-correction, rule-based interpretation, and automatic query generation, followed by smart chart logic for determining the right way to visualize the dimensions and measures in the data returned from the query.
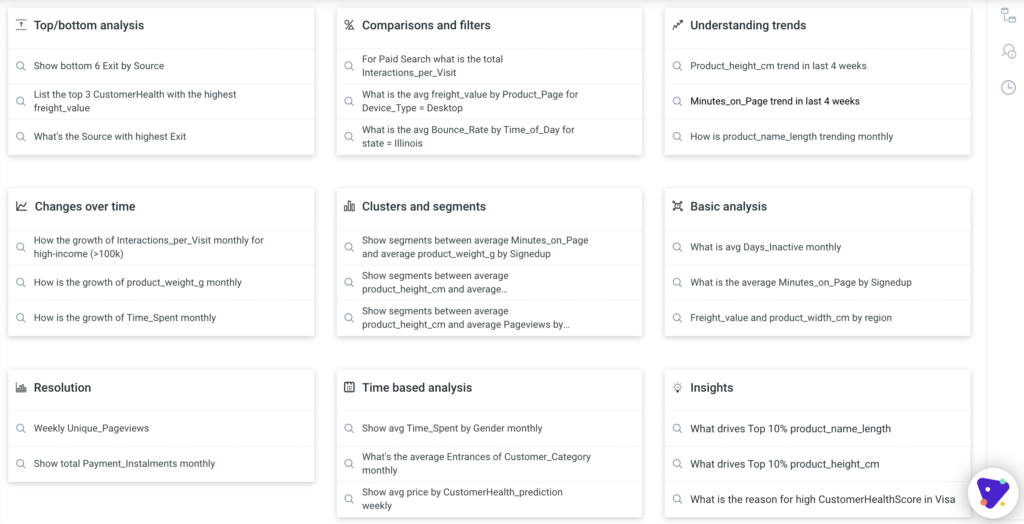
Using our innovative approach to query interpretation allows support for robust types of questions against source data, ranging from regular Top/Bottom Analysis, Change-over-time calculations, and Time-based analysis, to abstract comparisons or segmentation types of queries. Check out the Art of the Possible for Natural Search for detailed examples. Here is an overview of classes of questions that Tellius supports:
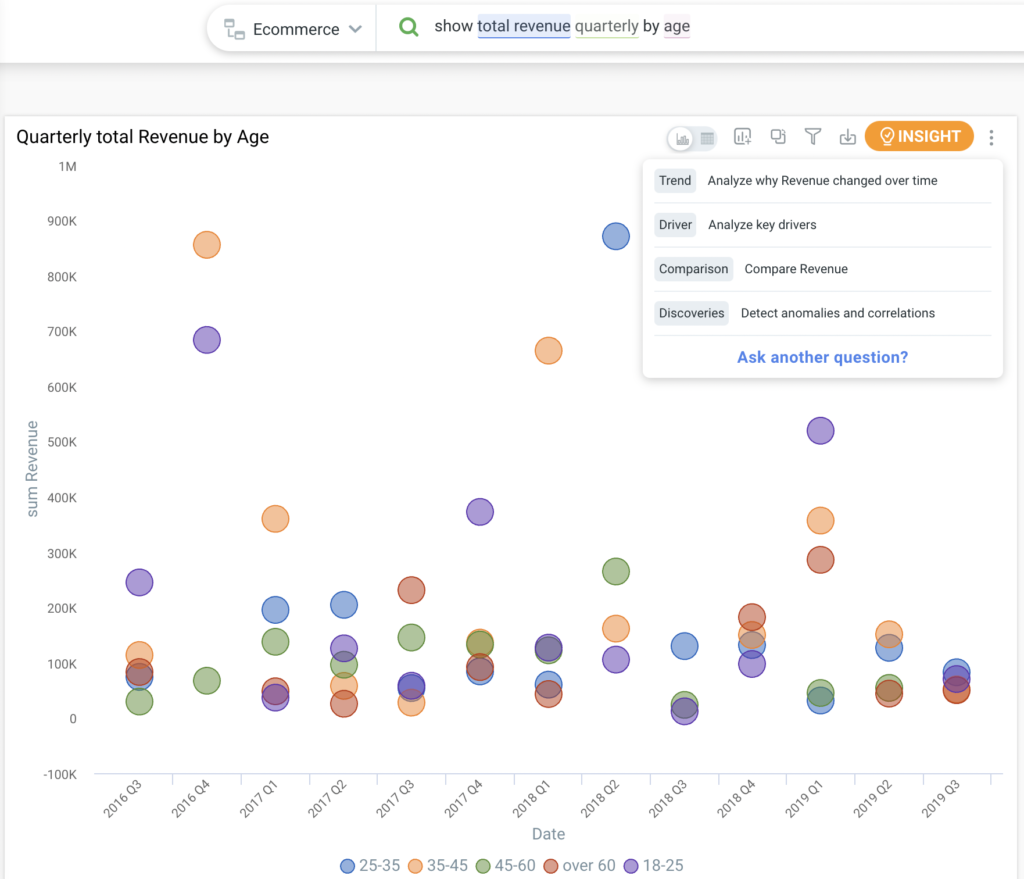
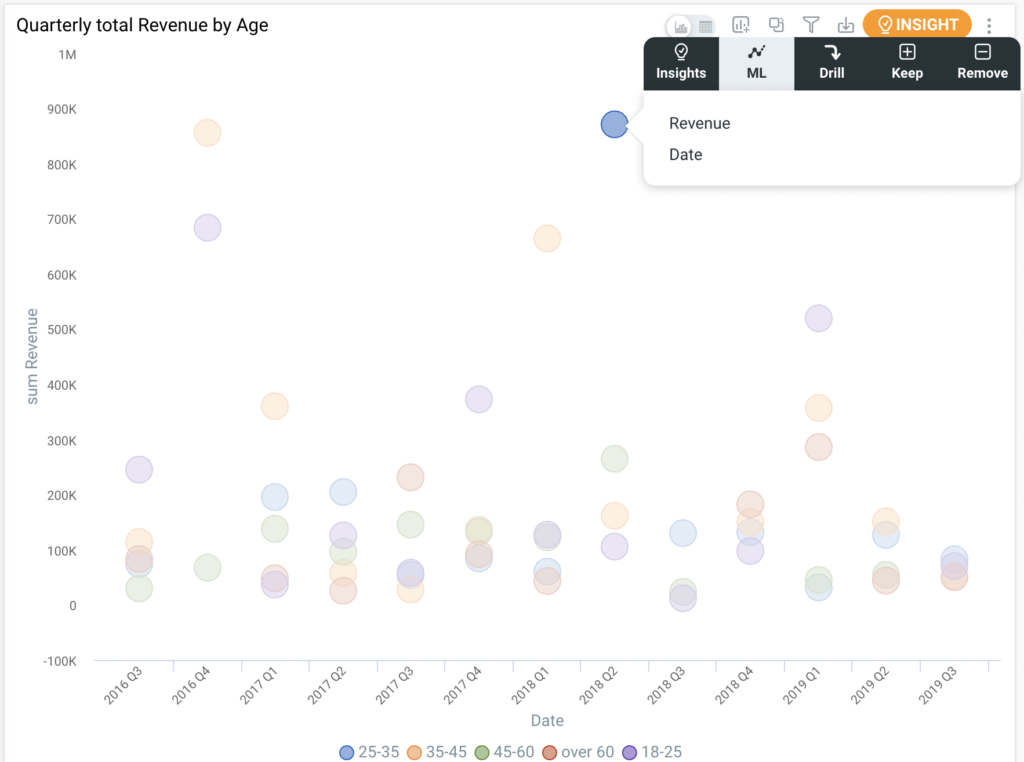
As search results get materialized in visualizations, anomalies and points of interest are automatically detected, and the user has the ability to jump directly into insights calculation or model building. The power of the hand-off between search-based exploration and insights is one of the main drivers of value for business users and their ability to be self-sufficient. They do not have to turn around to a different tool or a counterpart that has the coding skill sets to produce the insights they are looking for. This is how Tellius allows business users and analysts to satiate their business curiosity and scale – by continuing the journey from data to insights without interruption.
Insights: Let the Facts Speak for Themselves
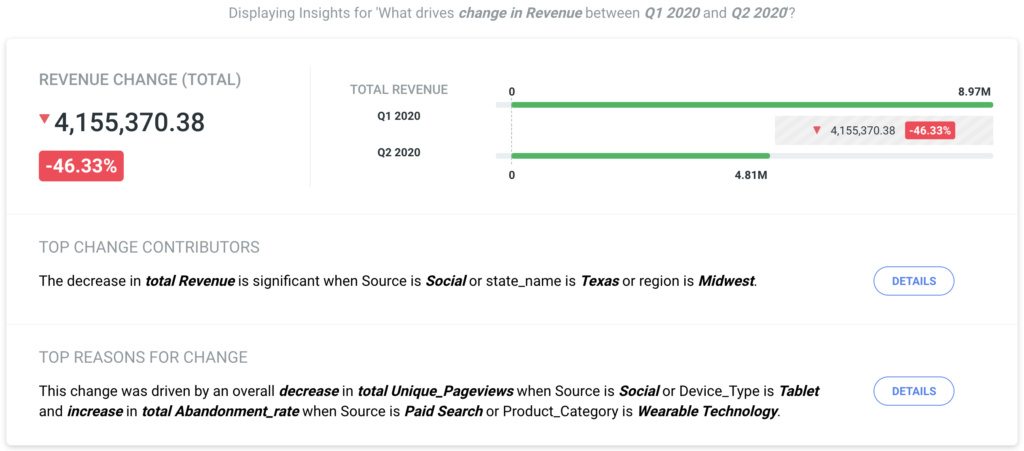
When transitioning from search-based exploration to insights, there are two distinct paths. The first path is directly navigating from search to insights. Tellius will calculate and present in a narrative form key Insights based on explicit search variables used in the queries. This is very useful when the user is uncovering something unexpected in data they want more information on. The second path is to create their own Insights from scratch in a guided workflow, independent of the search entry point and available to users at any time.
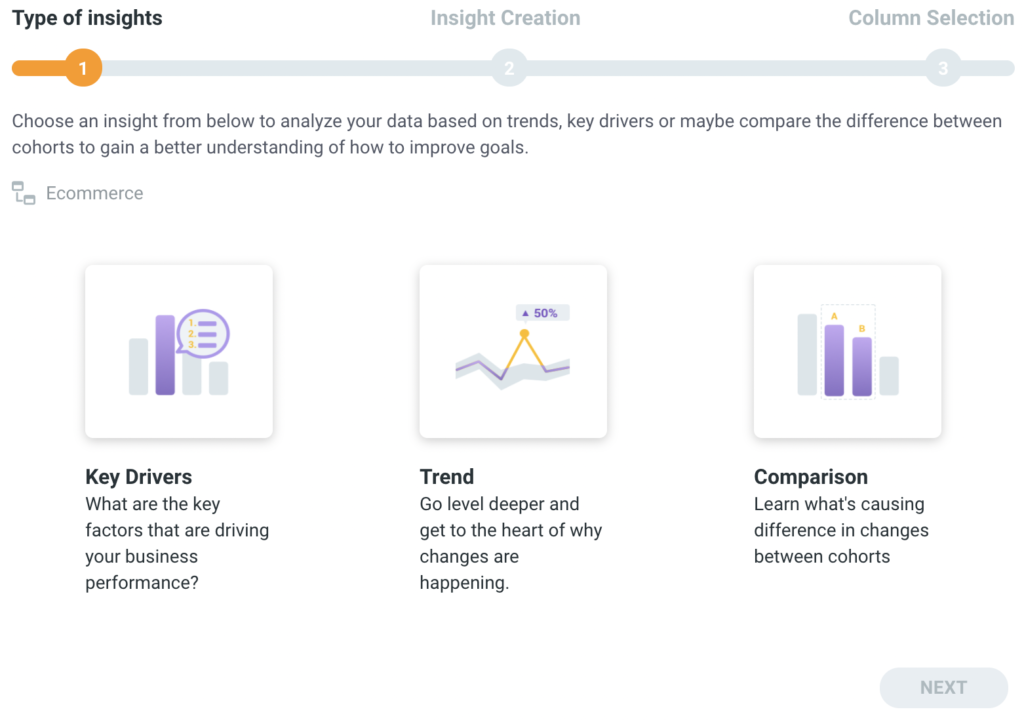
When exploring and interacting with data, users can select from classes of insights of interest. Trend analysis will provide a detailed narrative on what categories are driving the change, what measures are influencing the trend and recommendations on how to improve it. Comparison takes cohorts in the same dimension, and explains the differences in behavior between cohorts and identifies the contributors to those differences. Discoveries focus primarily on understanding anomalies/outliers and correlations between the measures that contribute to the level of the variable of interest.
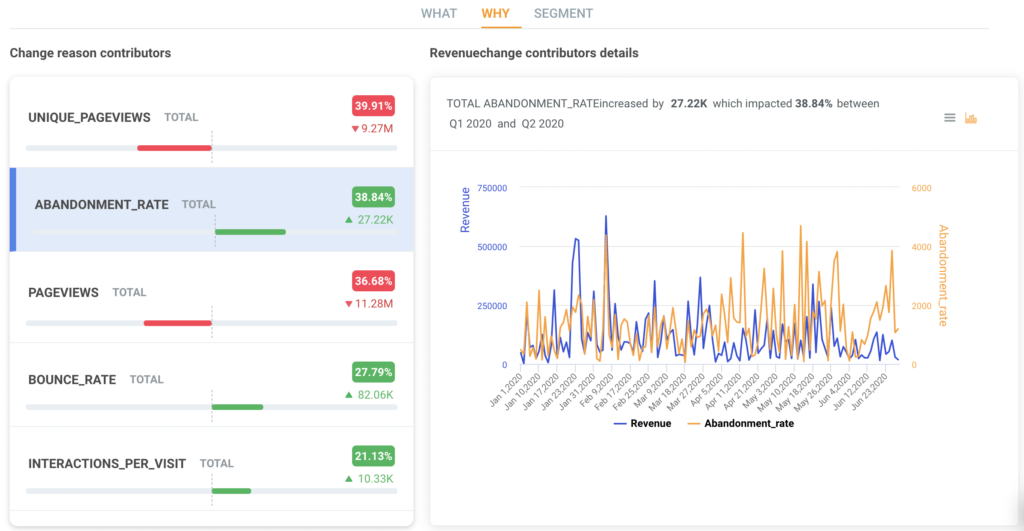
Tellius uses a variety of feature engineering and statistical computations in order to produce this analysis. We do not stop at showing basic changes in values, but also build in sophisticated relational transformations that will provide the user the magnitude and proportionality of the contributor impact on the variable of interest. The analysis has both categorical contributors that answer the question of “What” as well as measure or numeric contributors that answer the “Why”. We then rank the contributor impact based on how they are distributed and present the top significant ones in a narrative to the user.
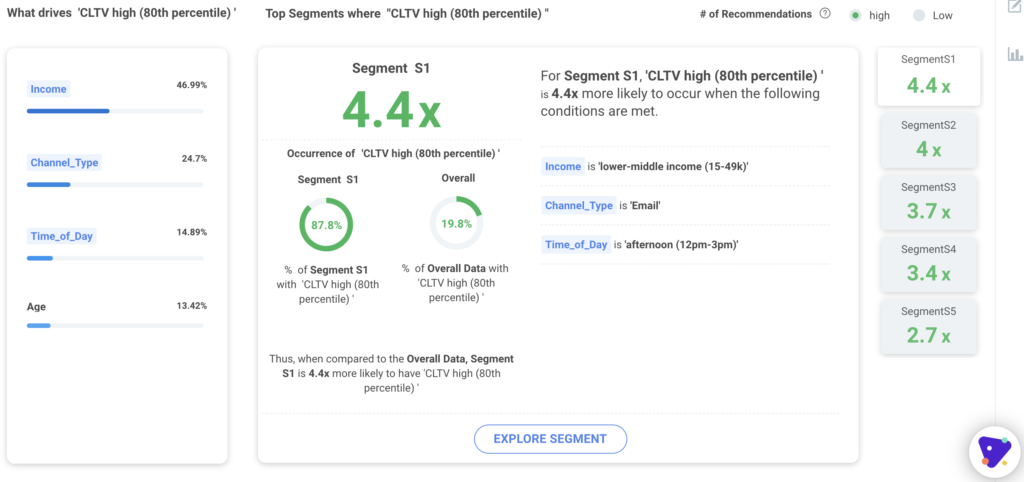
Tellius segment analysis enhances trend and cohort analysis by using machine learning to present recommendations on how to improve business outcomes. With explanations about the top performing segments and their characteristics, users are now armed with a deep understanding of the lever that needs to be adjusted to replicate the results broadly. The example below illustrates how certain segments in Customer Lifetime Value (CLTV) achieve superior performance compared to the entire population.
When it comes to taking the reins of building their own analysis, users can engage a simple workflow to create insights from scratch with optionality of what variables they want to analyze, across what timeframes, and what inputs they want to include or exclude. The insights building framework has an intuitive flow and does not require any “ninja” skills to navigate and quickly produce the insights needed.
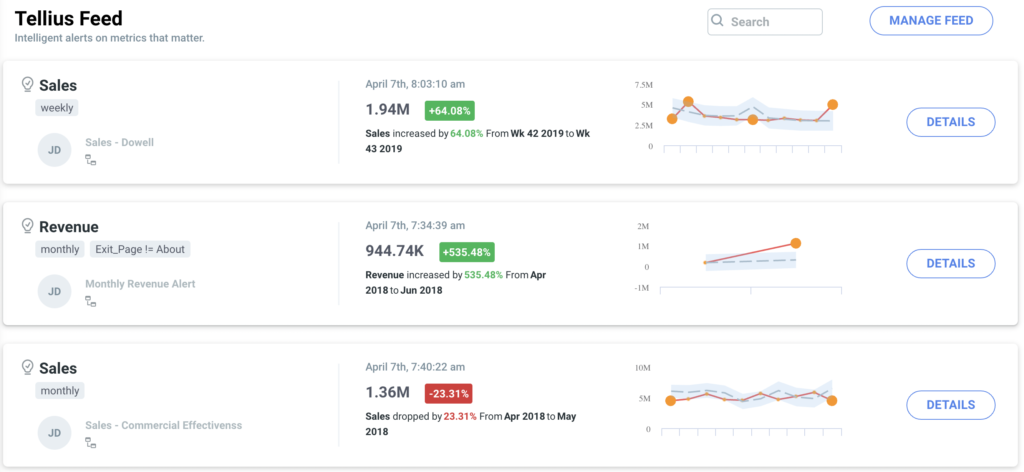
Once users have a metric that they want to run analysis on periodically, they can build intelligent automation called Feeds that proactively notify users when insights are calculated and need to be reviewed. This is very powerful as it combines both a pull (user uncovering and building insights) as well as a push (the system pushes the intelligence to the user) interaction.
The goal of this experience is for the users to have a fluid transition between asking business questions and getting meaningful insights immediately. For users that need to go deeper and take advantage of sophisticated machine learning techniques with more control, Tellius’ AutoML capability is available at their fingertips.
AutoML: Continue to a Deeper Level
The final piece of the trifecta is AutoML. We are in the golden age of automation for machine learning processes. Never before have business users had so much access and ability to employ ML capabilities, which will be crucial to achieving better business outcomes. Automating the machine learning lifecycle — effectively, using AI to enable ML — especially the training process, is baked into the Tellius experience; no special skills necessary, just curiosity.
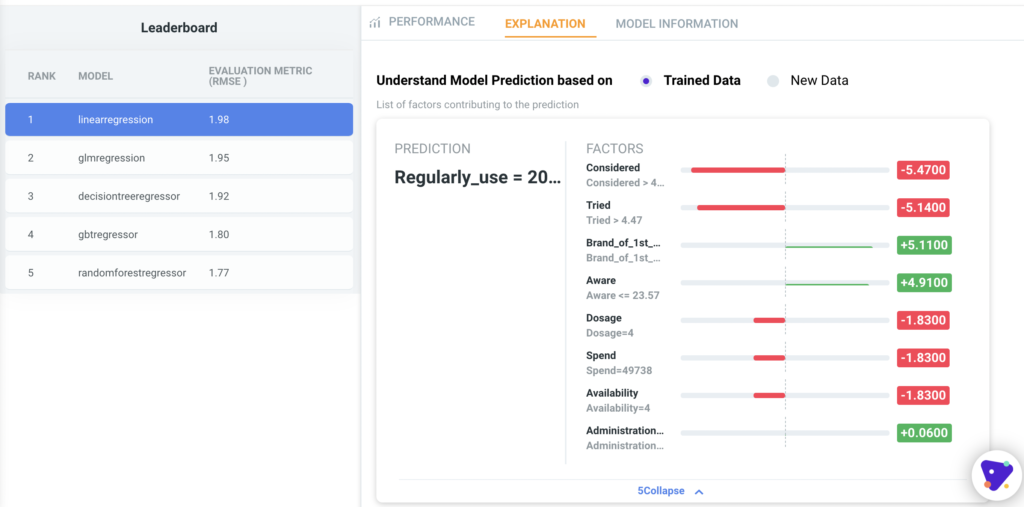
Tellius makes machine learning more accessible than ever. Users can start using AutoML from search by pointing to a target variable and letting Tellius do the rest. This predictive capability features a sophisticated feature engineering flow to enhance data modeling (cleaning, standardization, binning, imputation, etc) and a robust model training tournament approach for engaging multiple algorithms that ultimately results in a champion model for the best fit. Once training is complete, results are presented to the users using standard LIME methodology to explain model information, measurements, and performance.
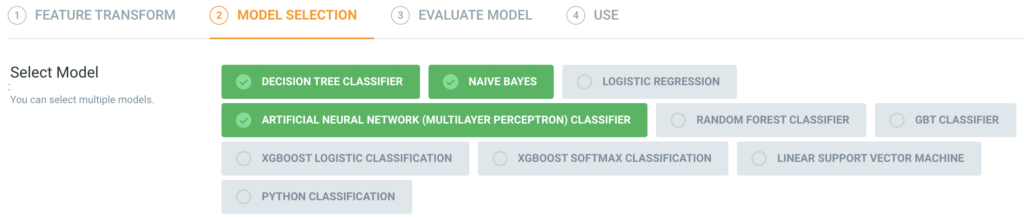
Alternatively, for more control, Tellius offers a point-and-click approach to building models in a templatized manner, as depicted below. This is where users can get more creative with the type of analysis that can be performed. Tellius offers multiple classes of analysis including regression, classification, clustering, time-series analysis, and recommendations. Tellius offers 27+ models out of the box and, for a more inclusive system for data scientists, the ability to bring your own model (BYOM) with our Python libraries integration (check out how you can do that here). The results are served with the same level of explainability and narrative as the AutoML process.
Tellius also supports Model Deployment so ML models can be put to work moving the needle for the business quickly. Users can score their model against new tables, or use a robust API to integrate ML outputs in other applications easily. This closes a very powerful journey along the analytics spectrum, from exploration all the way to intelligence creation and sharing capabilities that augment the business user to levels of productivity their business needs and expects. Use AI to enable the use of AI.
Beneficial Loops
The power of the Tellius Trifecta is that it enables business curiosity in a very human way. Business users, analysts, and data experts can chase clues, layer in domain expertise, act on intuitions, and check their logic in a dynamic, interconnected, and sometimes nonlinear, manner. No problem, nonlinear is a distinctly human approach. Our platform’s architecture and functionality, far from a “check the box” activity, is optimized to meet this collaborative and iterative approach:
- Tellius connects data of whatever shape and size from wherever (cloud or on-prem) — so that we can pursue our curiosity and look under all the rocks for the answer.
- Built-in Data Preparation exists because, as our curiosity dictates bringing in additional data to bear to try to answer the question, the data may need some cleaning.
- A Google-like natural language search experience is the most natural way to express curiosity — via a voice- or text-based search as we do most everything else in our lives.
- Seamless interconnection between Search, Insights, and Predictions, as outlined earlier means less switching time, and less risk of losing the scent of the insight chase.
- AutoML and Point-And-Click ML building exists to feed our curiosity to look around the proverbial corner at what the future might look like (to make better decisions).
- Tellius’ Dual Analytics engine exists to handle the split-second straightforward query searches (what was revenue in New York City?) as well as the more robust billion-row level insights generation necessary for advanced analytics (what drove revenue in NYC last month?).
The Journey is the Destination
The journey towards intelligence and data-driven decisions varies widely in organizations. It is a blend of technology, process, and collaboration, that at times seems elusive to many data leaders out there. Tellius is here to be an enabler in that journey, with a core belief that the Journey Should Be Easier. The use of AI should be in the service of the user experience and make these technologies more approachable. Instead of forcing analysts into additional technology learning curves, they could be spending their time actually solving business problems.
“The cure for boredom is curiosity. There is no cure for curiosity.” (Dorothy Parker) So if you find yourself curious in the next few days, please check out the new BI experience with a Tellius free trial.